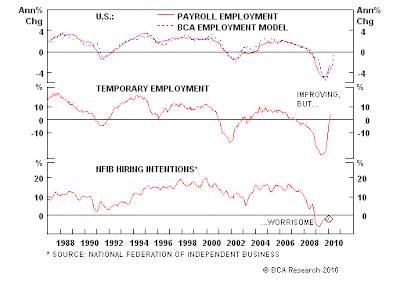


 Now explain to me.... I ask in my Didactic way.

Why would these be the same?
Financial history doesn't repeat itself, but it often rhymes. You can't be stupid enough to trade off anything I say.... I'm lucky they let me out of the straight-jacket long enough to trade.
3 comments:
I understand your point, and I'm not disagreeing, but unemployment, a lagging indicator, is not the ideal metric to compare 2004 and 2010 and try to relate this to stock price movement.
Industrial production or GDP would be a better comparo.
you are right, I was just grabbing charts last week, for this post. It just happed to be NFP week. but it is 10% less people with jobs to "Buy the recovery."
LEADing indicators:
"All of the leading indicators of industrial production pointed to a strong gain, including an increase in factory workers in January reported by the Labor Department."
http://www.marketwatch.com/story/january-industrial-output-up-for-7th-month-in-row-2010-02-17?reflink=MW_news_stmp
This is why the stock market is up. Can it change? Sure.
Post a Comment