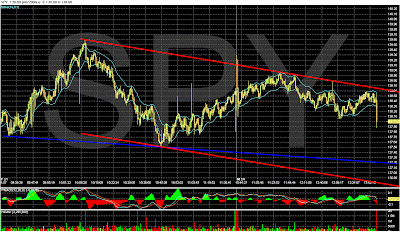
10 day chart This trend line should be violated then in a bullish trend we bounce back to the 12800/1400 level and retest.
 This trend line should be violated then in a bullish trend we bounce back to the 12800/1400 level and retest.
OR
THAT MOVE TWARD 1400 FAILS AND WE HAVE A NEW DOWNTREND CONFIRMED.
3 day chart
Caution... it would be normal that to get past the resistance at 1400 we have to bounce at it a few times.... and to pull back to some downside support then do a final violation of the trend.
Bearish is that we had a significant wedge formation, that indicates a reversal.
If we end the day down, based on our futures... That will be a confirmation of the downtrend.
If we end above 12725... Uptrend probably continues.... if at any time during the day we get above 12725... it neutralizes the downtrend.
I'll look for a good up-move for an exit for some of my long positions.
2 day micro chart

A little downside support in blue... and the possible developing downtrend trade channel.
(you can also draw a trade channel using the blue)
Today is going to take much more coffee....


No comments:
Post a Comment